

 One app for all your study abroad needs


Q- Look at the image below. In 25 seconds, please speak into the microphone and describe the details that the image is showing. You will have 40 seconds to give your response.
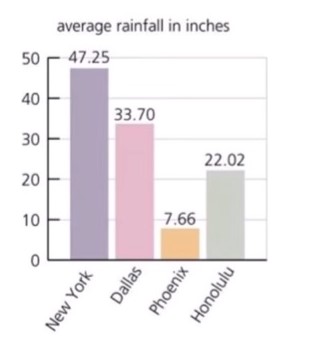
Ans- This bar chart represents the average rainfall in New York, Dallas, Phoenix, and Honolulu. The highest rainfall was seen in New York at 47.25 inches whereas the lowest amount of rainfall was in the city of Phoenix at 7.66 inches. The city of Dallas faced 33.7 inches while Honolulu saw almost 22 inches of rainfall. In conclusion, New York City was the wettest while Phoenix city was the driest among the four.
Check out the audio sample of this answer below.👇
Need help preparing for PTE? Check out the best PTE preparation courses in the market offered in a live training environment by trusted educators. If you want to ease your study abroad journey, then call us at 1800-572-130.
 2,00,000+ students realized their study abroad dream with us. Take the first step today.