

 One app for all your study abroad needs


Q- Look at the graph below. In 25 seconds, please speak into the microphone and describe the details that the graph is showing. You will have 40 seconds to give your response
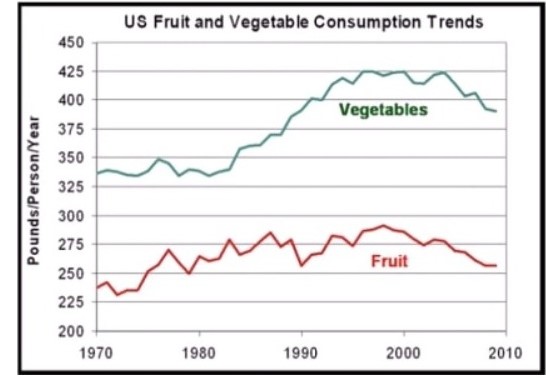
Ans- The consumption trends of fruits and vegetables in the US are shown in this line graph. According to data from 1970 to 2010, vegetables were more widely consumed than fruits during that time. Vegetable consumption, however, dramatically climbed starting in 1980, while the fruit consumption trend remained largely stable with a maximum consumption of 280 pounds approximately. However, between 200 and 2010, there was a decline observed in the intake of both.
Check out the audio sample of this answer below.👇
Need help preparing for PTE? Check out the best PTE preparation courses in the market offered in a live training environment by trusted educators. If you want to ease your study abroad journey, then call us at 1800572130.
 2,00,000+ students realized their study abroad dream with us. Take the first step today.