

 One app for all your study abroad needs


Q- Look at the image below. In 25 seconds, please speak into the microphone and describe the details that the image is showing. You will have 40 seconds to give your response.
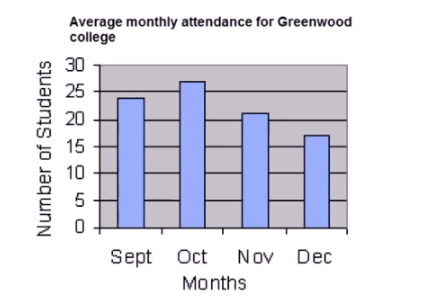
Ans- The bar graph illustrates the average monthly attendance at Greenwood College from September to December. Attendance started at around 24 students in September, which increased to over 25 students in October, but experienced a significant decline in November and December, reaching approximately 18 students.
Check out the audio sample of this answer below.👇
Need help preparing for PTE? Check out the best PTE preparation courses in the market offered in a live training environment by trusted educators. If you want to ease your study abroad journey, then call us at 1800-572-130.
 2,00,000+ students realized their study abroad dream with us. Take the first step today.