

 One app for all your study abroad needs


Pie charts, which are a common part of data interpretation aptitude sections on upcoming competitive exams like GRE, GMAT, CAT, XAT, SSC CGL, RRB Group D, Bank PO exams, JEE Main and Advanced, NEET, etc., are a good way to test your ability to look at and understand information clearly. Most of the time, you will be shown a pie chart that shows how percentages are spread out in different groups. There will then be a set of questions that require you to use the facts to do mathematical calculations, compare things, and draw conclusions. Understand the relationships between slice sizes and center angles and be familiar with basic mathematics concepts.
This blog will help you give good answers to questions about Pie charts. To succeed excellently in these competitive exams, you need to know how to read pie charts because that lets you get useful information from graphs and solve problems quickly.
Contents
What are Pie Charts? What are Pie Chart Problems?
Pie charts are a common way to show how different parts of a statistic are distributed. They are made up of a circle that is cut into slices. Each slice represents a group, and the size of each slice is related to its value. It’s easy to see at a glance how big different groups are compared to each other in this way.
Key elements of a pie chart
- Circle: Represents the whole dataset.
- Slices: Each slice represents a category within the dataset.
- Area of a Slice: Proportional to the value of the corresponding category.
- Labels: Usually included to identify each category.
- Legend: It’s optional, and provides additional information about the categories and their values.
Common Applications of Pie Charts in Data Interpretation
- Duration of Expenses: Analyzing how a budget is allocated across different categories (e.g., Food, Rent, Transportation).
- Market Share: Comparing the sizes of different companies or brands within a market.
- Election results: Visualizing the proportion of votes received by different candidates.
- Survey results: Displaying the distribution of responses to different questions.
What are Pie Charts Problems?
In the context of data interpretation, the following is a breakdown of the common problems that arise with pie charts.
Data Presentation
- The Chart: You’ll be presented with a pie chart displaying various categories, each depicted as a distinct slice.
- Labels and Values: Each slice will be labeled with its corresponding category name and percentage value.
Question Types
- Comparison: Questions might ask you to compare the sizes of different slices, find the differences between them, or calculate their ratios.
- Proportions: You might be required to determine what percentage of the whole a specific category represents or vice versa.
- Changes and Trends: Sometimes, questions will compare data from multiple pie charts to analyze changes or trends over time.
- Calculations: Depending on the question, you might need to perform calculations using the provided percentages or derive additional values based on the data.
Pie Charts Formulas
You can understand pie charts correctly by following these easy methods and rules. They will turn data into visually interesting reports. When used correctly, pie charts can show information in a way that is clear and rewarding.
Here are the Essential Formulas
- Finding the Angle of Slice
| Formula: Angle of a slice (in degrees) = (value of the slice / Total value of all slices) x 360 |
- Calculating the Percentage of a Slice
| Formula: Percentage of Slice = (Value of the slice / Total value of all slices) x 100 |
- Determining the Value of a Slice
| Formula: Value of a slice = (Percentage of the slice / 100) x Total value of all slices |
Also Read: Reasoning Questions: Types, Sample Ques, Worksheet
20+ Pie Chart Questions and Answers
Directions: The following pie chart shows the percentage distribution of the expenditure incurred in publishing a book. Study the pie chart and answer the questions based on it.
Various Expenditures (in percentage) Incurred in Publishing a Book
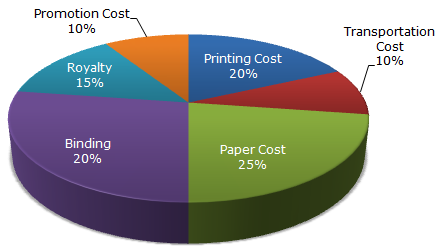
Q1. If for a certain quantity of books, the publisher has to pay Rs. 30,600 as printing cost, then what will be the amount of royalty to be paid for these books?
- Rs. 19,450
- Rs. 21,200
- Rs. 22,950
- Rs. 26,150
Answer: Option C
Solution: Let the amount of Royalty to be paid for these books be Rs.
Then, 20 : 15 = 30600 : r
=> r = Rs.(30600 x 15)= Rs. 22,950.
Q2. What is the central angle of the sector corresponding to the expenditure incurred on Royalty?
- 15°
- 24°
- 54°
- 48°
Answer: Option C
Solution: Central angle corresponding to Royalty = (15% of 360)°
=(15/100 x 360)°
=54°.
Q3. The price of the book is marked 20% above the C.P. If the marked price of the book is Rs. 180, then what is the cost of the paper used in a single copy of the book?
- Rs. 36
- Rs. 37.50
- Rs. 42
- Rs. 44.25
Answer: Option B
Solution: Clearly, the marked price of the book = 120% of C.P.
Also, the cost of paper = 25% of C.P.
Let the cost of paper for a single book be Rs. n.
Then, 120:25 = 180:n
=> n = Rs.(25 x 180/120)= Rs.37.50.
Q4. If 5500 copies are published and the transportation cost on them amounts to Rs. 82500, then what should be the selling price of the book so that the publisher can earn a profit of 25%?
- Rs. 187.50
- Rs. 191.50
- Rs. 175
- Rs. 180
Answer: Option A
Solution: For the publisher to earn a profit of 25%, S.P. = 125% of C.P.
Also Transportation Cost = 10% of C.P.
Let the S.P. of 5500 books be Rs. x.
Then, 10:125 = 82500 : x
=> x = Rs.(125 x 82500/10)= Rs.1031250.
Therefore S.P. of one book = Rs.(1031250/5500) v= Rs.187.50.
Q5. Royalty on the book is less than the printing cost by:
- 5%
- 33⅕%
- 20%
- 25%
Answer: Option D
Solution: Printing Cost of book = 20% of C.P.
Royalty on book = 15% of C.P.
Difference = (20% of C.P.) – (15% of C.P) = 5% of C.P.
Percentage difference = (Difference/Printing Cost x 100)%
=(5% of C.P./Printing Cost x 100)% = 25%.
Directions: The following pie charts exhibit the distribution of overseas tourist traffic from India. The two charts show the tourist distribution by country and the age profiles of the tourists respectively.
Distribution of Overseas Tourist Traffic from India.
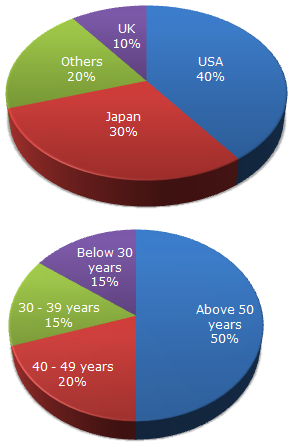
Q6. What percentage of Indian tourists went to either the USA or the UK ?
- 40 %
- 50 %
- 60 %
- 70 %
Answer: Option B
Solution: (40+10) = 50% (from the first pie chart)
Q7. The ratio of the number of Indian tourists that went to the USA to the number of Indian tourists who were below 30 years of age is?
- 2:1
- 8:3
- 3:8
- Cannot be determined
Answer: Option B
Solution: 40:15 = 8:3
Q8. If amongst other countries, Switzerland accounted for 25% of the Indian tourist traffic, and it is known from official Swiss records that a total of 25 lakh Indian tourists had gone to Switzerland during the year, then find the number of 30-39-year-old Indian tourists who went abroad in that year?
- 18.75 lakh
- 25 lakh
- 50 lakh
- 75 lakh
Answer: Option D
Solution: Tourist traffic from other countries to Swiz is 20%.
= Amongst this 20%, 25% of traffic from India.
So, 25% of 20% = 5% corresponds to the Indian traffic in Switzerland.
= 5 % corresponds to Switzerland’s 25 lakh.
Hence 15% will be 75 lakh.
Directions: The following pie chart gives information about the distribution of weight in the human body according to different kinds of components. Study the pie charts and answer the question.
Distribution of Weight in Human Body
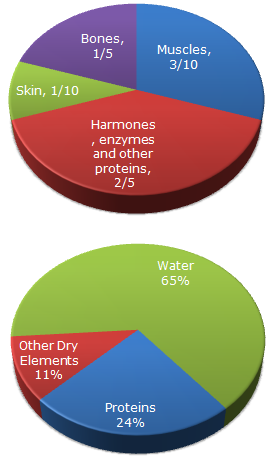
Q9. What percentage of proteins in the human body is equivalent to the weight of its skin?
- 41.66 %
- 43.33 %
- 44.44 %
- Cannot be determined
Answer: Option A
Solution: Total percentage = (10 / 24) x 100 = 41.6666667%
Q10. How much of the human body is neither made of bones or skin?
- 40 %
- 50 %
- 60 %
- 70 %
Answer: Option D
Solution: 20 + 10 = 30% is made up of either bones or skin.
Hence, 70% is made up of neither.
Q11. What is the ratio of the distribution of proteins in the muscles to that of the distribution of proteins in the bones?
- 2:1
- 2:3
- 3:2
- Cannot be determined
Answer: Option D
Solution: It cannot be determined since the respective distributions are not known.
Directions: The following pie chart shows the sources of funds to be collected by the National Highways Authority of India (NHAI) for its Phase II projects. Study the pie chart and answer the question that follows.
Sources of funds to be arranged by NHAI for Phase II projects (in crores Rs.)
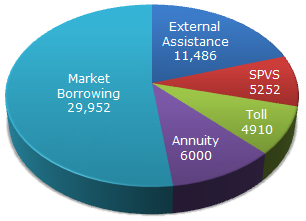
Q12. Near about 20% of the funds are to be arranged through:
- SPVS
- External Assistance
- Annuity
- Market Borrowing
Answer: Option B
Solution: 20% of the total funds to be arranged = Rs. (20% of 57600)crores
= Rs. 11520 crores
= Rs. 11486 crores.
= Rs.11486 crores is the amount of funds to be arranged through External Assistance.
Q13. If NHAI could receive a total of Rs. 9695 crores as External Assistance, by what percent (approximately) should it increase the Market Borrowing to arrange for the shortage of funds?
- 4.5%
- 7.5%
- 6%
- 8%
Answer: Option C
Solution: Shortage of funds arranged through External Assistance
Therefore = Rs. (11486 – 9695)crores
= Rs. 1791 crores.
Therefore Increase required in Market Borrowing = Rs. 1791 crores.
Percentage increase required = (1791/29952 x 100)% = 5.98% = 6%.
Q14. If the toll is to be collected through an outsourced agency by allowing a maximum 10% commission, how much amount should be permitted to be collected by the outsourced agency, so that the project is supported with Rs. 4910 crores?
- Rs. 6213 crores
- Rs. 5827 crores
- Rs. 5401 crores
- Rs. 5316 crores
Answer: Option C
Solution: Amount permitted = (Funds required from Toll for projects of Phase II) + (10% of these funds)
= Rs. 4910 crores + Rs. (10% of 4910) crores
= Rs. (4910 + 491) crores
= Rs. 5401 crores.
Q15. The central angle corresponding to Market Borrowing is
- 52°
- 137.8°
- 187.2°
- 192.4°
Answer: Option C
Solution: Central angle corresponding to Market Borrowing = (29952/57600 x 360°= 187.2°)
Q16. The approximate ratio of the funds to be arranged through Toll and that through Market Borrowing is
- 2:9
- 1:6
- 3:11
- 2:5
Answer: Option B
Solution: Required ratio = 4910/29952 = 1/6.1 ~=1/6.
Directions: Study the following pie chart and the table and answer the questions based on them.
The proportion of Population of Seven Villages in 1997
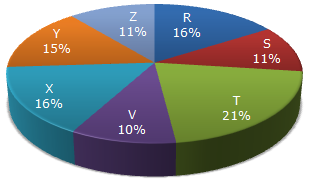
| Village | % Population Below Poverty Line |
| X | 38 |
| Y | 52 |
| Z | 42 |
| R | 51 |
| S | 49 |
| T | 46 |
| V | 58 |
Q17. If the population of village R in 1997 is 32000, then what will be the population of village Y below the poverty line in that year?
- 14100
- 15600
- 16500
- 17000
Answer: Option B
Solution: Population of village R = 32000 (given).
Let the population of village Y be y.
Then, 16 : 15 = 32000 : y
=> y = (15 x 32000/16) = 30000.
Therefore, the Population of village Y below the poverty line = 52% of 30000 = 15600.
Q18. The ratio of the population of village T below the poverty line to that of village Z below the poverty line in 1997 is
- 11:23
- 13:11
- 23:11
- 11:13
Answer: Option B
Solution: Let N be the total population of all the seven villages.
Then, the population of village T below the poverty line = 46% of (21% of N),
and the Population of village Z below the poverty line = 42% of (11% of N)
Therefore Required ratio = 46% of (21% of N) / 42% of (11 % of N) = 46 x 21 / 42 x 11 = 23/11.
Q19. Find the population of village S if the population of village X below the poverty line in 1997 is 12160.
- 18500
- 20500
- 22000
- 26000
Answer: Option C
Solution: Let the population of village X be x.
Then, 38% of x = 12160
=> x = 12160 x 100/38 = 32000.
Now, if s is the population of village S, then
16:11 = 32000:s
=> s =(11 x 3200/16) = 22000.
Q20. If in 1998, the population of villages Y and V increase by 10% each and the percentage of the population below the poverty line remains unchanged for all the villages, then find the population of village V below the poverty line in 1998, given that the population of village Y in 1997 was 30000.
- 11250
- 12760
- 13140
- 13780
Answer: Option B
Solution: Population of village Y in 1997 = 30000 (given).
Let the population of village V in 1997 be v.
Then, 15:10 = 30000:v
=> v = 30000 x 10 = 20000.
Now, the population of village V in 1998 = 20000 + (10% of 20000) = 22000.
Therefore, the Population of village V below the poverty line in 1998 = 58% of 22000 = 12760.
Tips to Solve Pie Chart Questions
Mastering pie charts is important for doing well on parts of many competitive exams that ask you to interpret data. Break these questions down into manageable sections with these tips.
- Befriend the Formulas: Angle of a Slice, Percentage of a slice, and Value of a slice.
- Slice it Logically: Arrange the slices in descending order for easier comparison and use different and clear colors to avoid confusion.
- Label Like a Legend: Ensure each slice has a concise label mentioning the category and its value/percentage.
- Estimation: Don’t get bogged down by complex calculations, use approximations to answer the question.
- Identify keywords like “percentage difference”, “highest/lowest”, or “ratio” to choose the relevant formula.
- Regularly solve pie chart questions from sample papers and mock tests.
- Analyze your mistakes and identify areas for improvement.
- Time yourself to build speed and accuracy under exam pressure.
Also Read Verbal Reasoning Archives – Leverage Edu
FAQs
Ans. Pie Charts are great for showing data that shows a single “whole” broken up into separate parts, with no more than 10 groups. You can think of them as pictures of numbers, like budgets, demographics, or poll results.
Ans. Yes, definitely! For comparing many groups, especially when numbers are close, they’re not the best. Focus on similar sets and stay away from 3D effects and “exploded” slices that make comparisons less accurate.
Ans. Just use these simple formulas: Percentage of a slice (Value of slice / Total value x 100%), and Angle of a slice(value of slice / Total value x 360).
This was all about the “Pie Charts Questions”. For more such informative blogs, check out our Study Material Section, or you can learn more about us by visiting our Indian exams page.
 2,00,000+ students realized their study abroad dream with us. Take the first step today.