 One app for all your study abroad needs


The difference between variance and deviation is that the deviation (aka standard deviation) indicates how far individual points are from the average (mean). It’s expressed in squared units (e.g., metres, years). Whereas variance represents the average squared distance from the mean. It’s expressed in squared units (e.g., meters², years²).

What is Variance?
Imagine a collection of leaves. Variance tells you how far each leaf is from the average leaf size. High variance means leaves vary greatly in size, while low variance indicates similar-sized leaves. In statistics, it’s the average of squared distances from the mean (average value). This table provides a comprehensive overview of variance, covering its definition, formula, properties, notation, interpretation, and calculation methods.
| Definition | Variance is the expected value of the squared deviation of a random variable from its mean. |
| Formula | Var(X) = E[(X – E(X))^2] |
| Var(X) = E[X^2] – (E[X])^2 | |
| Properties | Additive property: Var(X + C) = Var(X), where C is a constant. Constant multiple property: Var(CX) = C^2.Var(X), where C is a constant. Linear transformation property: Var(aX + b) = a^2.Var(X), where a and b are constants. Sum of independent variables property: Var(X1 + X2 + … + Xn) = Var(X1) + Var(X2) + … + Var(Xn), if X1, X2, …, Xn are n independent random variables. |
| Notation | Variance is symbolically represented by σ^2, s^2, or Var(X). |
| Interpretation | A higher variance indicates a greater spread of data points from the mean, suggesting higher variability or dispersion. Lower variance implies data points are closer to the mean, indicating less variability or dispersion. |
| Relationship with standard deviation | Variance is the square of the standard deviation, i.e., variance = (standard deviation)^2 = σ^2. |
| Calculation | 1. Compute the mean of the data set. 2. Subtract the mean from each data point to get deviations. 3. Square each deviation. 4. Take the average of the squared deviations to get the variance. |
Must Read:Difference Between Parallel and Perpendicular
What is Deviation?
The standard deviation measures the spread of data from the mean, reflecting typical deviations. It returns to its original units, making it popular for variability assessment. Closed data to the mean yields a low deviation; spread data indicates a high variance. It’s affected by all values, making it independent of origin but not scale. It’s crucial in advanced statistical analyses. This table summarises the key aspects of standard deviation, including its definition, calculation formula, properties, interpretation, application, and an example scenario.
| Definition | Standard Deviation measures the extent of variation or dispersion from the mean in a dataset. It indicates the typical deviation from the mean. |
| Calculation Formula | Standard Deviation (σ) = √[Σ(x – μ)^2 / N] Where: σ is the standard deviation- x is each data point- μ is the mean of the dataset- N is the total number of data points |
| Properties | The standard deviation is independent of the origin but not of the scale. |
| It is the square root of the variance, the average of the squared differences from the mean. | |
| Interpretation | Let’s consider calculating the standard deviation for the number of gold coins on a pirate ship. The population standard deviation formula is used if the population size (total pirates) is known. If only a sample is available, the sample standard deviation formula is applied. |
| Example | Let’s consider calculating the standard deviation for the number of gold coins on a pirate ship. The population standard deviation formula is used if the population size (total pirates) is known. If only a sample is available, the sample standard deviation formula is applied. |
Must Read :Difference Between Marginal Cost and Average Cost
What is the Difference between Variance and Deviation
This table provides a concise overview of the differences between Variance and Standard Deviation, covering aspects such as definition, calculation formula, expression, mathematical notation, indicator of, measure of, nature of measure, calculation method, and application.
| Variance vs Deviation | Variance | Standard Deviation |
| Definition | Numerical value describing the variability of observations. | Observations’ dispersion within a dataset. |
| Calculation Formula | Average of squared deviations. | Square root of the mean square deviation. |
| Expression | Expressed in squared units. | Expressed in the same units as the data. |
| Indicator of | Perfect indicator of individual spread within a group. | Perfect indicator of observation spread in a dataset. |
| Measure of | Dispersion of values relative to their mean. | How far numbers are spread from their average in a dataset. |
| Nature of Measure | Measures absolute variability. | Determines the size of data spread. |
| Calculation Method | Calculated by taking the square root of the variance. | Calculated by taking the average of the squared deviations of each value from the mean. |
Similarities Between Variance and Deviation
Variance and deviation are both concepts used in statistics to describe how spread out data is from its average value (the mean).Imagine a target with the bullseye being the mean. Deviation tells you how far each dart lands from the bullseye, while variance tells you the average squared distance of all the darts from the bullseye. Here are the most important similarities between them:
- Both variance and deviation quantify how far individual data points fall from the mean. A higher value indicates a larger spread, meaning data points are further from the average.
- They are often used together to understand the distribution of data. Variance provides the squared distance on average, while deviation gives an idea of the raw distance from the mean.
Variance and Deviation Formulas
The average square distance between each data value and the mean value represents the data set’s variance, The distribution of data values around the mean is defined by the standard deviation. The population, as well as the sample variance formula, is given by:
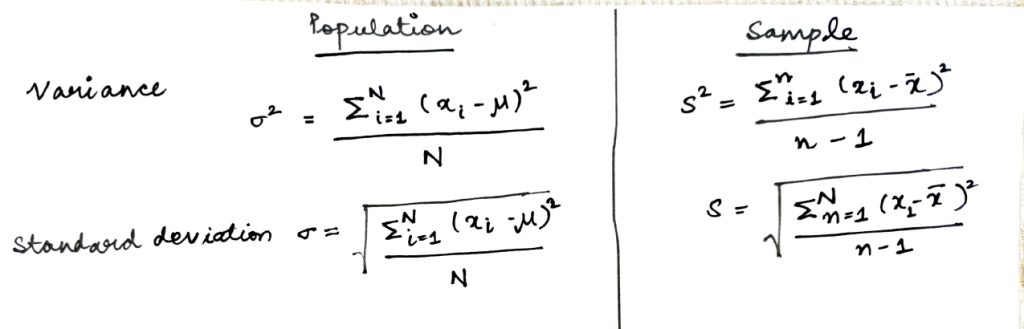
Here,
- σ2 = Population variance
- N = Number of observations in population
- Xi = ith observation in the population
- μ = Population mean
- s2 = Sample variance
- n = Number of observations in the sample
- xi = ith observation in the sample
- σ = Population standard deviation
- s = Sample standard deviation
Application of Variance and Deviation in Real Life
Variance and deviation, though similar, serve distinct purposes in real life.Below we have mentioned some real life applications of variance and standard deviation and explained them using examples:
- Variance: Imagine a bakery. Ovens might have slight temperature differences. Variance tells you how much bread baking times differ from the average. A high variance means some buns burn while others stay raw.
- Standard Deviation (deviation): It’s like a “spread meter.” In the bakery example, the standard deviation tells you how many buns fall within a specific time range around the average baking time. A low deviation indicates consistent baking, while a high one suggests uneven temperatures.
RELATED BLOGS
FAQ’s
Variance measures dispersion around the mean in a dataset. Deviance assesses model fit in statistical analysis.
Mean deviation calculates the average absolute deviation from the mean. Variation indicates the overall spread or variability in data.
The range shows the difference between max and min values. Variance computes average squared deviation. The standard deviation is its square root.
No, variance measures the average squared deviation from the mean. Deviation represents individual data point’s distance from the mean.
This was all about the “Difference Between Variance and Deviation”. For more such informative blogs, check out our Study Material Section, you can learn more about us by visiting our Indian exams page.