

 One app for all your study abroad needs


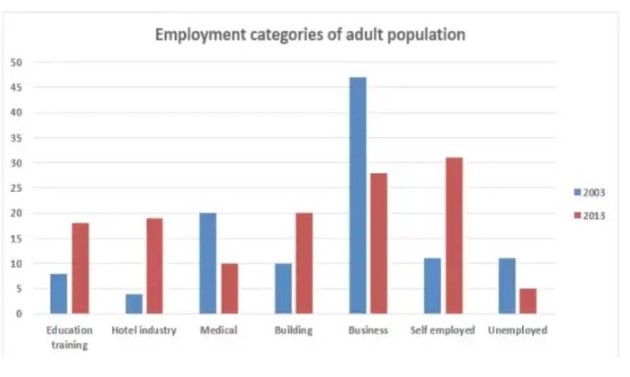
Question: The chart shows the employment status of adults in the US in 2003 and 2013. Summarise the information by selecting and reporting the main features, and make comparisons where relevant. Write at least 150 words
Sample 1
| The percentage of American adults employed in various occupations from 2003 to 2013 is shown in the bar graph.Overall, it can be observed that over the course of ten years, there were declines in the medical and commercial sectors and rises in the percentages of persons working in education and training, the hotel industry, the building industry, and the self-employment sector. Additionally, at this time, the rate of unemployment significantly decreased.About 8%, 3%, and 10% of American adults worked in education and training, the hotel business, and construction, respectively, in 2003. Over the ensuing ten years, all of these figures increased to roughly 20%. In addition, the proportion of self-employed workers nearly tripled during this time, rising from 10% to slightly over 30%. A quarter of Americans who were employed in 2013 chose to start their own firms, a fall of double from 2003. Similarly, the percentage of those working in the medical field decreased over time by 50%, from 20% to 10%. |
Sample 2
| The bar chart illustrates the employment distribution across various sectors among American adults in 2003 and 2013. Over the decade, significant changes occurred in employment trends, with declines in some sectors and growth in others, alongside a noticeable decrease in unemployment rates. In 2003, approximately 8% of adults worked in education and training, 3% in the hotel industry, and 10% in construction. By 2013, these figures saw substantial increases, with education and training, the hotel industry, and construction each accounting for around 20% of employed individuals. The self-employment sector experienced the most dramatic growth, with its share tripling from 10% in 2003 to over 30% in 2013, reflecting a surge in entrepreneurial activity. Conversely, the medical sector witnessed a significant decline, with its share halving from 20% in 2003 to 10% in 2013. Similarly, the proportion of individuals employed in commercial ventures dropped sharply, from 25% in 2003 to approximately 12.5% in 2013. These shifts suggest a growing preference for self-employment and other sectors, while traditional fields like medicine and commerce saw reduced participation. |
Sample 3
| The bar chart compares the employment percentages of American adults in different occupations for the years 2003 and 2013. Overall, it highlights a shift away from traditional fields like medicine and commerce toward growth in self-employment, education, and other sectors. In 2003, education and training employed 8% of the workforce, the hotel industry 3%, and construction 10%. By 2013, all three sectors saw marked growth, each contributing around 20% to employment figures. Self-employment experienced the most notable rise, tripling from 10% in 2003 to over 30% in 2013.On the other hand, the medical field’s share dropped significantly, from 20% in 2003 to 10% in 2013. The commercial sector, which accounted for 25% of employment in 2003, also saw its percentage halved to about 12.5% in 2013.These changes underscore a broader trend toward diversification in employment, with increasing emphasis on emerging and self-driven career opportunities. |
Successfully preparing for the IELTS Writing Section, requires consistent practice, a clear strategy, and the right resources. By linking your responses between IELTS Writing Part 1 and IELTS Writing Task 2 , you can showcase your ability to elaborate on topics and provide insightful answers.
If you’re finding it challenging to prepare, consider taking an IELTS Mock Test to evaluate your progress or join our offline or online IELTS classes at Leverage Edu to enhance your skills and boost your confidence, ensuring you are fully prepared for your IELTS Speaking Test and one step closer to achieving your study abroad aspirations.
 2,00,000+ students realized their study abroad dream with us. Take the first step today.